How to Visualize a Google Sheets Spreadsheet in Looker Studio (Formerly Google Data Studio)
Google Sheets is a powerful tool for managing data, but sometimes you need more advanced visualization capabilities. Looker Studio (formerly Google Data Studio) allows you to create and share interactive data visualizations. This tutorial will guide you through the process of visualizing a Google Sheets spreadsheet in Looker Studio using Anyquery.
Prerequisites
Before starting, ensure you have the following:
- A working installation of Anyquery (refer to the installation guide for more information).
- A Google account with access to Google Sheets and Looker Studio.
- The Google Sheets plugin installed in Anyquery.
Install the Google Sheets Plugin
First, install the Google Sheets plugin:
anyquery install google_sheets
Follow the instructions to authenticate with Google and connect to your Google Sheets spreadsheet. You'll need to provide the client ID, client secret, and a token. You can find detailed instructions in the Google Sheets plugin documentation.
Step 1: Set Up the Anyquery Server
Launch the Anyquery server:
anyquery server
Because Looker Studio is a web-based tool and Anyquery binds locally, you need to expose the server to the internet. Use a tool like ngrok to create a secure tunnel to your local server:
ngrok tcp 8070
Copy the forwarding URL (e.g., tcp://0.tcp.ngrok.io:12345) and use it as the hostname in the next step.
Step 2: Connect Looker Studio to Anyquery
- Open Looker Studio in your browser.
- Click on the
+icon (empty report) to create a new report. - In the search bar, type
MySQLand select theMySQLconnection. - Authorize Looker Studio to access your data.
- Fill in the following details:
- Looker Studio does not support table selection directly. Run SQL queries by clicking on the "Personalized query" tab and typing your query. For example,
SELECT * FROM google_sheets_spreadsheet. - Click on the
Authenticatebutton to verify that the connection is successful.

Step 3: Create Visualizations in Looker Studio
- Once connected, you can start building your report by adding charts, tables, and other visual elements.
- Use the personalized query feature to run specific SQL queries on your Google Sheets data. For example:
SELECT * FROM google_sheets_spreadsheet
- Customize your visualizations by configuring dimensions, measures, and filters as needed.
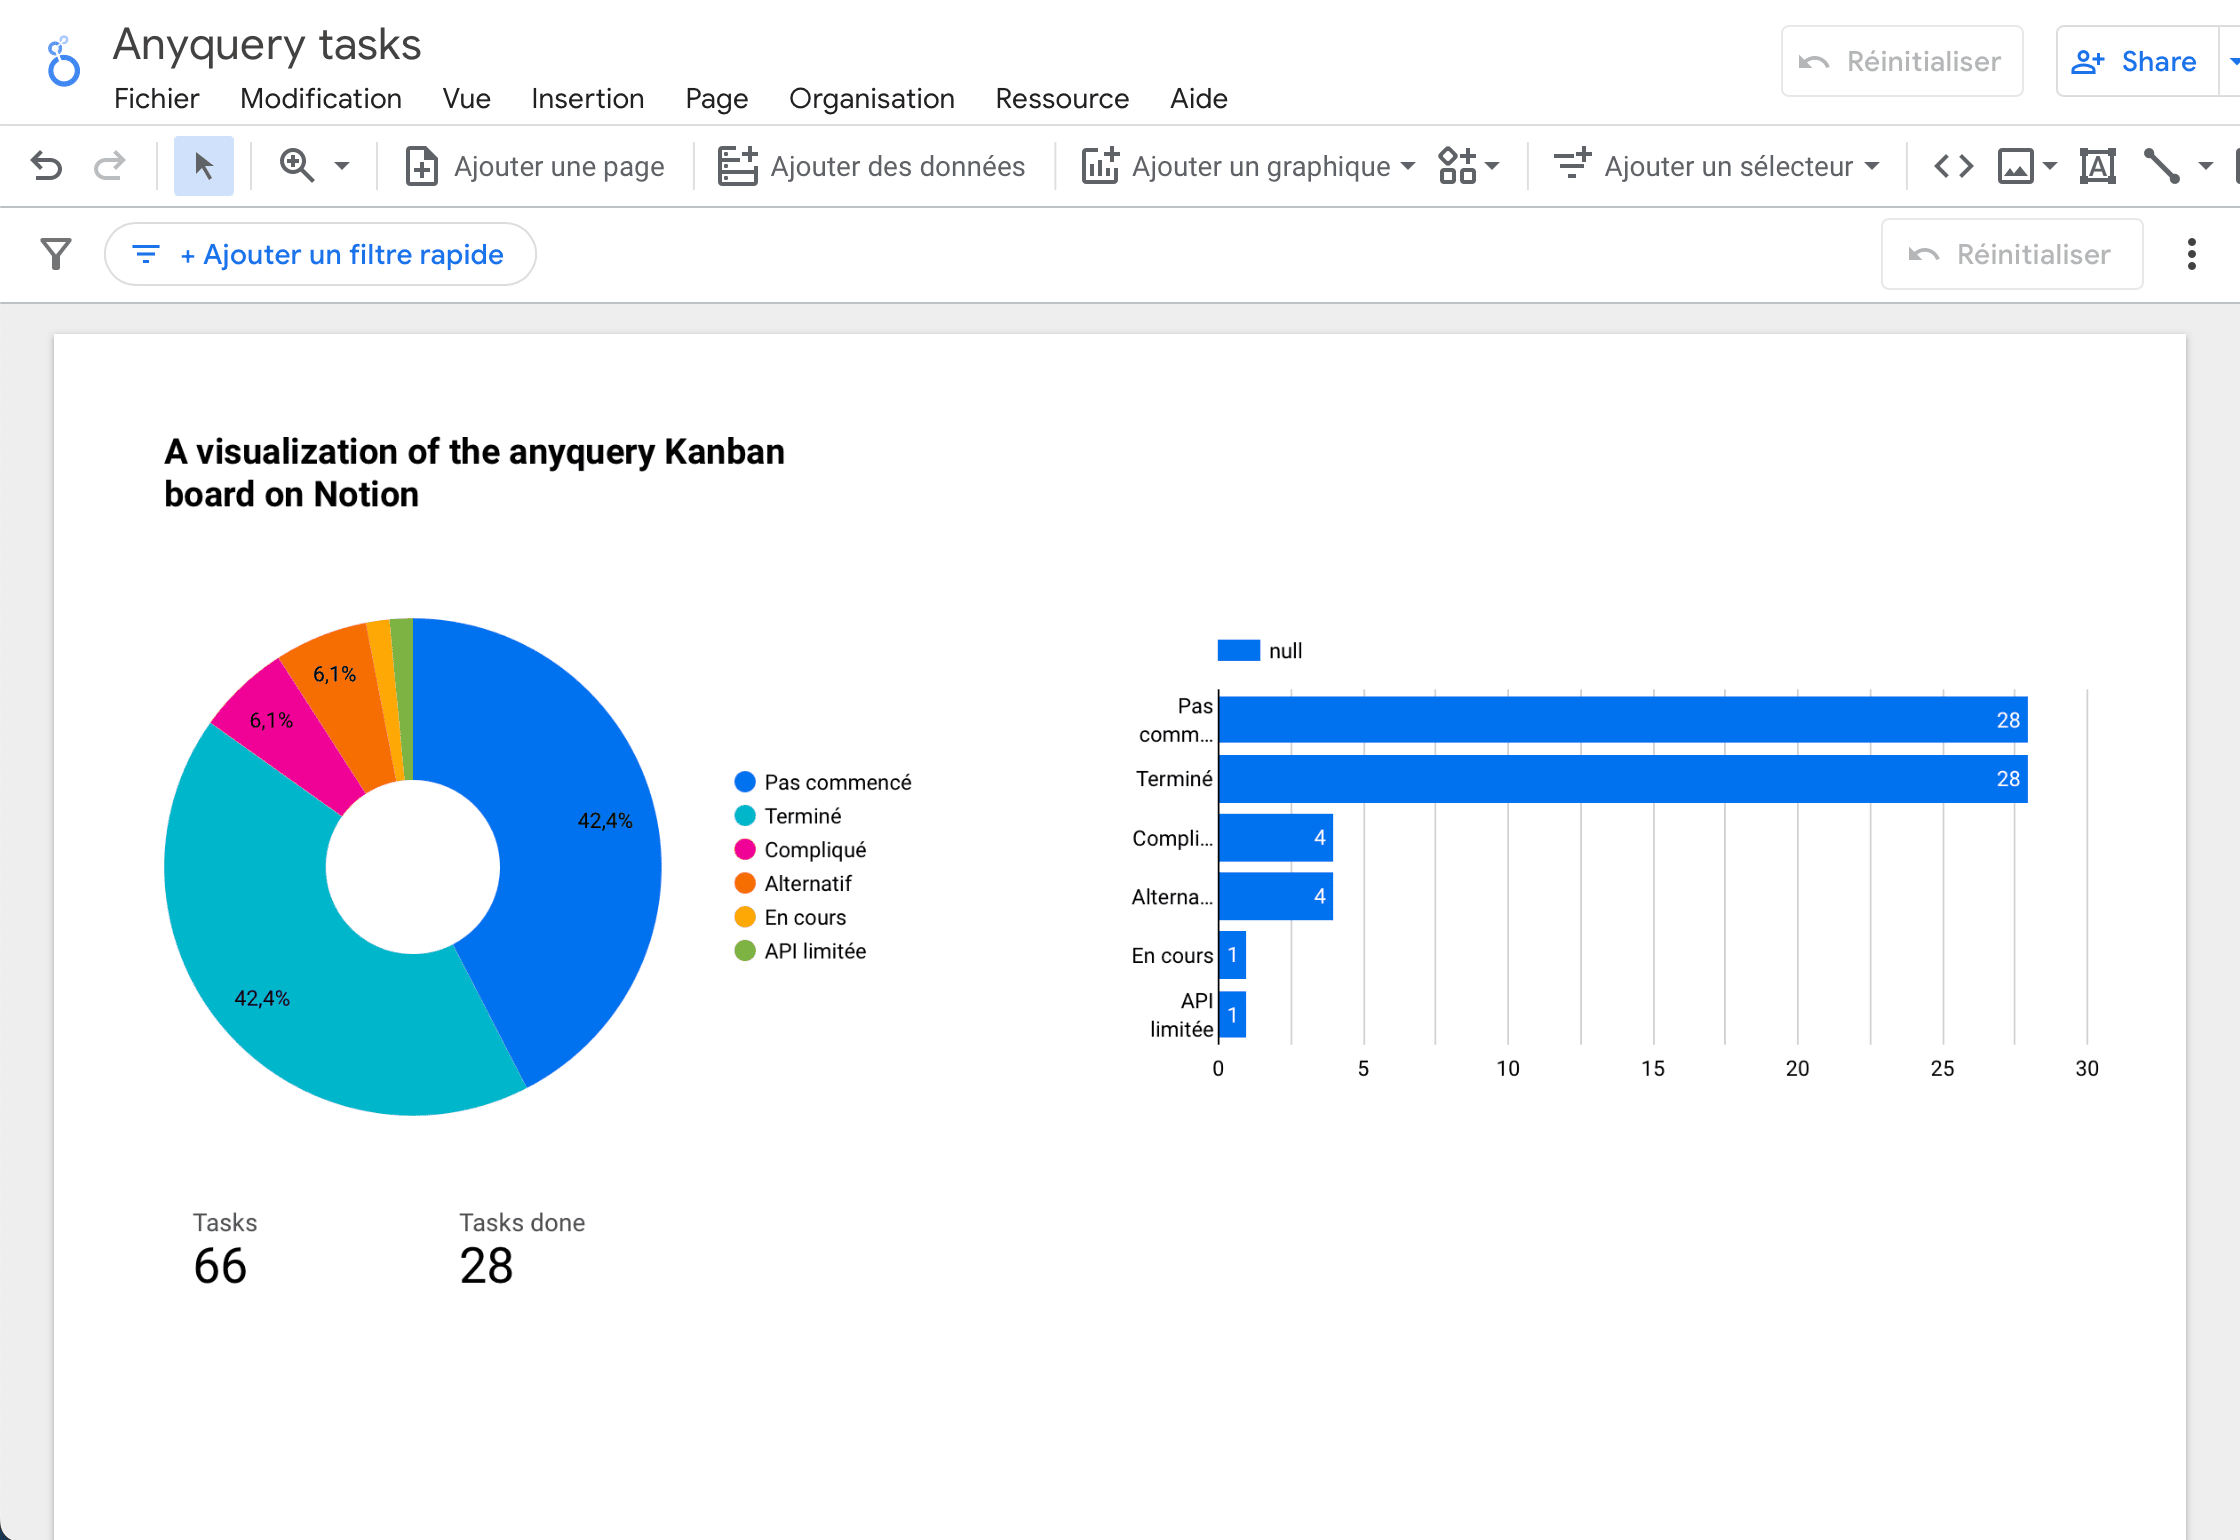
Example Visualization
Here is an example of a Looker Studio dashboard visualizing data from a Google Sheets spreadsheet:
Conclusion
You have successfully connected Looker Studio to Anyquery and visualized data from a Google Sheets spreadsheet. You can now explore and create interactive data visualizations using Looker Studio.
For more information on using Anyquery with Looker Studio, refer to the Looker Studio documentation.
