How to Visualize a Google Sheets Spreadsheet in Tableau
In this tutorial, we'll show you how to visualize data from a Google Sheets spreadsheet in Tableau using Anyquery. Anyquery is a versatile SQL query engine that can query data from various sources, including Google Sheets. We'll use Anyquery to access the Google Sheets data and then connect Tableau to visualize the data.
Prerequisites
Before starting, ensure you have the following:
- A working installation of Anyquery (Refer to the installation guide)
- Tableau Desktop installed and activated
- Google Sheets plugin installed in Anyquery
Step 1: Set Up Google Sheets Plugin
First, install the Google Sheets plugin in Anyquery. Follow the Google Sheets plugin setup guide to authenticate and configure the plugin.
anyquery install google_sheets
During the setup, you will be asked for:
- OAuth Client ID
- OAuth Client Secret
- Token (generated during the authentication process)
- Spreadsheet ID (found in the URL of your Google Sheets)
Complete the setup by following the instructions provided in the guide.
Step 2: Launch Anyquery Server
Once the plugin is installed and configured, launch the Anyquery server to expose the data for Tableau.
anyquery server
Step 3: Set Up Tableau Connection
Open Tableau Desktop and click on
MySQLin theConnectpane (left side) under the sectionTo a Server.Fill in the following details:
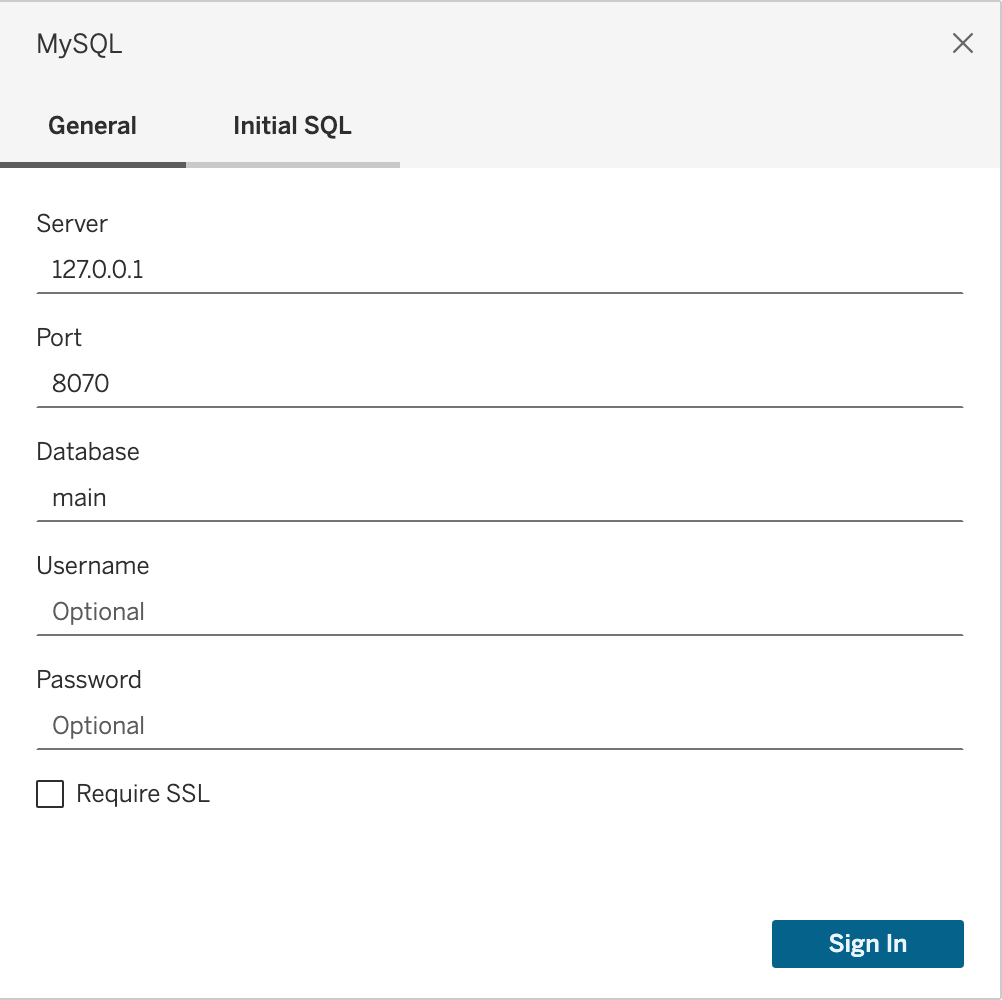
- Click on the
Sign Inbutton to verify that the connection is successful.
Step 4: Visualize Data in Tableau
On the left sidebar, you can see the list of tables. Drag and drop the table corresponding to your Google Sheets data to the canvas to create a new worksheet.
Fill in the columns and rows to create your visualization. For example, you can create charts, graphs, and dashboards based on the data in your Google Sheets spreadsheet.
Here is an example of a breakdown of data from a Google Sheets spreadsheet visualized in Tableau:

Conclusion
You have successfully connected Tableau to Anyquery and visualized data from a Google Sheets spreadsheet. You can now create interactive dashboards and share them with your team. For more information, refer to Tableau and Anyquery documentation.
